Recently I imported some custom reports in Google Analytics that I found online. They have been eye opening indeed! My most favorite ones are the Profit Index and Time of Day custom reports.
Google Analytics assigns a page value to each and every page you have, provided you use Goals. Without using Goals, this won’t work! In my previous post, I wrote about how I started using Goals to see how readers interacted with my site. I arbitrarily assigned a value of $1 each time the reader clicked on a tag or stayed on a post for more than 5 minutes.
I began searching through Google to see if could find a way to lower my bounce rates because I switched back to WordPress (that’s for another post altogether). As soon as I switched back, I noticed an increase in bounce rates and that bothered me.
I found out that bounce rates are really just people going to one page (usually my home page) and then dropping off. The majority of the visitors have no desire or incentive to continue through the site. The ones that do usually end up on my Tutorial page.
In my sleuthing I found something called the Profit Index. This is a fantastic report you can build for you Google Analytics as a custom report. The Profit Index can show you what posts have a high value but have the highest bounce rates! You can also see which pages have the highest Adsense revenue vs bounce rates. Once you know where the problem is, you can work to fix it.

For the most part all my posts are incredibly sticky and OK page value vs bounce rate, but I never dreamed that the Stock Trend Following post has such a high drop off rate.
Time of Day
This custom report is a fun one for me. It let’s me look at what time of day readers come to my site, what day the come to my site, and most importantly what time AND day they come to my site. Originally written by Dan Barker, it’s very enlightening for me!

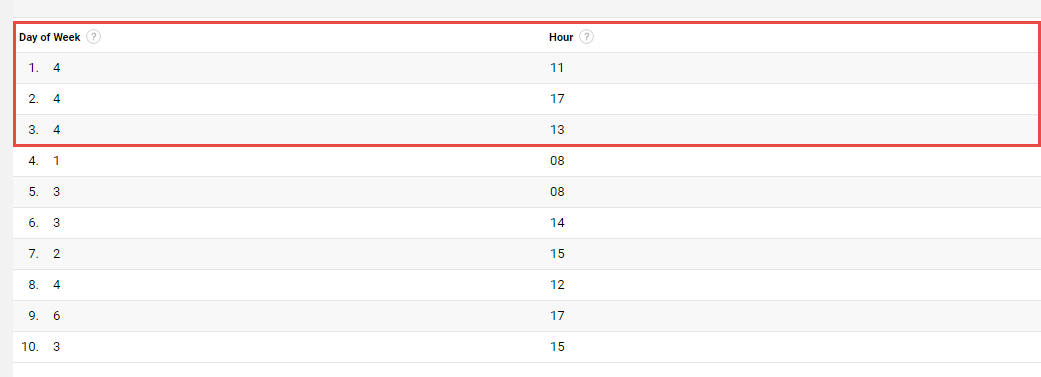
Over the course of the last 30 days, my most popular visit days have been Thursdays at 11AM, 1PM, and 5PM. The numbers change when I look at them from across the year but Thursday at 11AM appears to be the winner. Is it any wonder why I scheduled this post for today and at this time?
Note: Day 0 is Sunday.
Get Custom Reports in Google Analytics
Getting custom reports in Google Analytics is pretty easy if the creator has shared them. With the exception of the Profit Index, the Time of Day report is shareable and easy to install in your Google Analytics dashboard. You can easily rebuild the Profit Index report by following the instructions on the their website, it’s pretty easy but eye opening!
If you want more reports, just visit this page here. They have some great free ones!
Handy Low Cost Cheat Sheets To Kick Start Your Learning