Gold & Silver Market Report for Oct 3, 2020
Market Report Gold SilverIt’s Saturday October 3, 2020 and this is this week’s gold and silver market report.
Gold and Silver closed higher in the metals market this week by +2.21% and +4.05% to $1,907.60 and $24.03 respectively. Both metals are consolidating from last week’s sell off and appear to have found buyers at these levels. The market chatter is that coin and bullion investors see this pull back as a prime buying opportunity. With the prevailing sentiment and strong uptrends for both metals intact, our outlook for both Gold and Silver remains higher for the rest of year but we consider this intermediate support to be weak and both metals could go lower from here in the short tern.
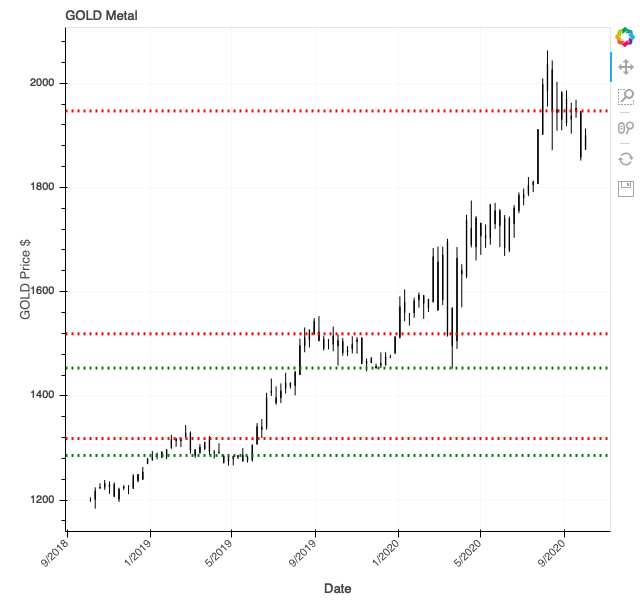
Gold Chart
Buying Gold and Silver Bullion and Coins
Sometimes it's hard to find a good coin dealer. In those cases I like to check out what's available on Amazon. Here are some options to gold bullion and coins from there.
Based on this week’s price action Gold prices made a Bearish Engulfing candle last week and an inside candle this week. This is indicative that Gold prices could fall in the short term, however our models show a slightly higher price target for Gold at $1,909.74 for next week’s close. We remain cautious at this level because Gold could sell off to the $1,800 level from here.
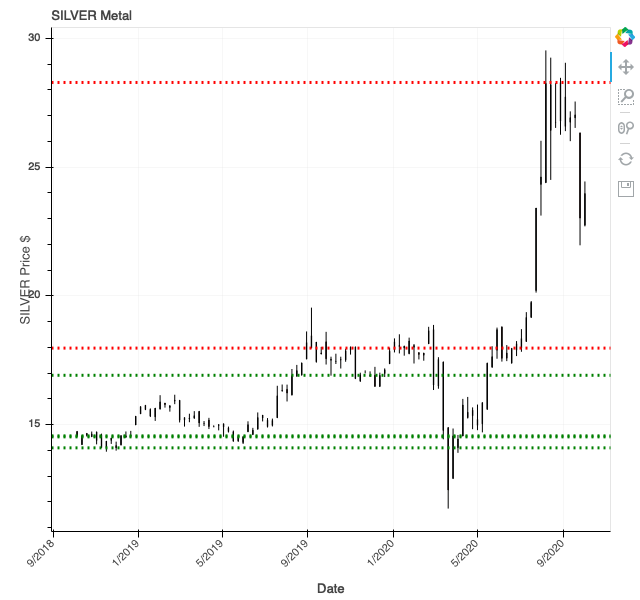
Silver Chart
Our proprietary models have generated a new resistance line for Silver. The new resistance line for Silver to beat is now $28.28. As with Gold, Silver’s price action last week created a Bearish Engulfing candle with an inside candle being formed this week. This technical pattern indicates possible trouble for this metal for the short term. Our models are showing a slightly higher price at $24.31 for next week’s close but Silver could make a move lower from here to the $19 level.
Our analysis shows that the ‘shake out’ might not be over yet and that more short term sell offs are on the horizon. Next week’s market action will confirm if that’s true or we will turn to go higher from here.