Gold & Silver Market Report for Oct 18, 2020
Market Report Gold SilverIt’s Sunday October 18, 2020 and this is your week’s gold and silver market report. Gold and Silver closed flat this week with a loss of -1.03% and -2.80% to $1,906.40 and $24.41 respectively. Both metals are trying to break higher but can’t seem to close above the bearish candle from 3 weeks ago. This is not good for the short term. It looks as though we may be entering into a protracted consolidation zone and where prices may fluctuate wildly at these levels.
Gold Chart
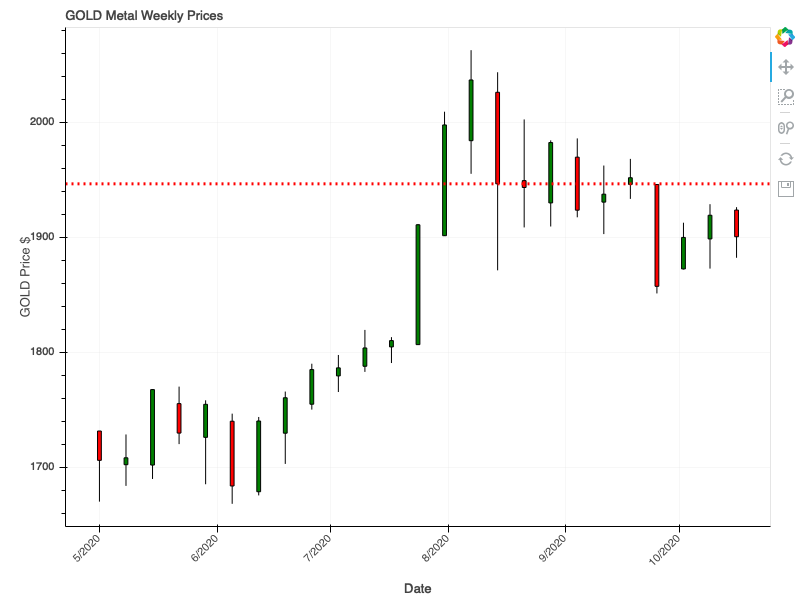
Gold is near it’s resistance line but struggling to break above it. We expect Gold’s price to start fluctuating wildly as buyers and sellers struggle to establish a clear direction higher or lower Our models show that Gold will close slightly lower next week with a price objective of $1904.48.
Buying Gold and Silver Bullion and Coins
Sometimes it's hard to find a good coin dealer. In those cases I like to check out what's available on Amazon. Here are some options to gold bullion and coins from there.
Silver Chart
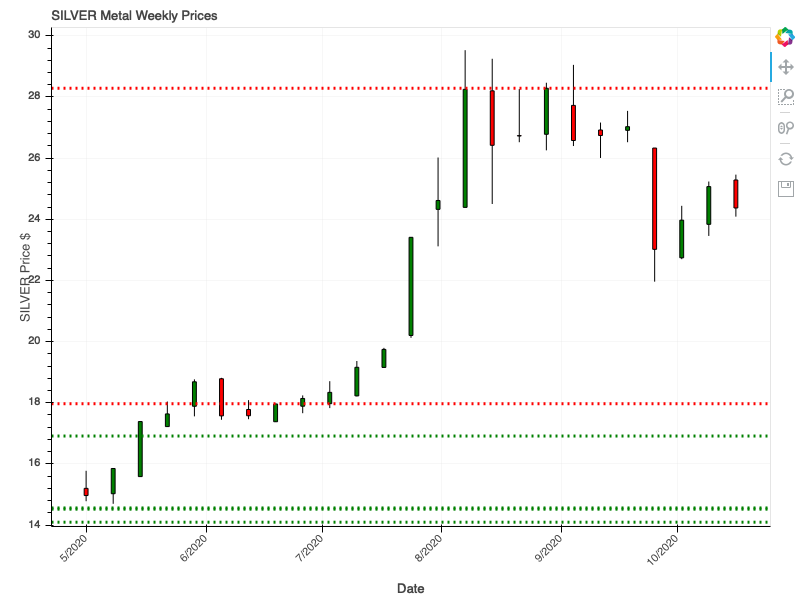
Silver is forecasted to close lower this week around the $23.89 price mark. It’s also struggling to move higher from it’s sell off 3 weeks ago but because of Silver’s volatile nature and it’s massive run up in July 2020, we’re concerned that Silver prices could collapse from these levels down to $18 - $17 before resuming it’s upward trend. We will monitor the price action of Silver closely for the next few weeks.
Buying Gold and Silver Bullion and Coins
Sometimes it's hard to find a good coin dealer. In those cases I like to check out what's available on Amazon. Here are some options to buying silver bullion and coins from there.
Gold to Silver Ratio Chart
We are adding a gold to silver ratio chart to the weekly report to help us forecast widening or contracting metal to metal ratios. Historically gold’s price has always traded 50 times of silver’s price. Today the ratio tends to be between 70 to 80. Changes to this ratio may indicate buying or selling pressure for both gold and silver. It’s a ratio to watch.
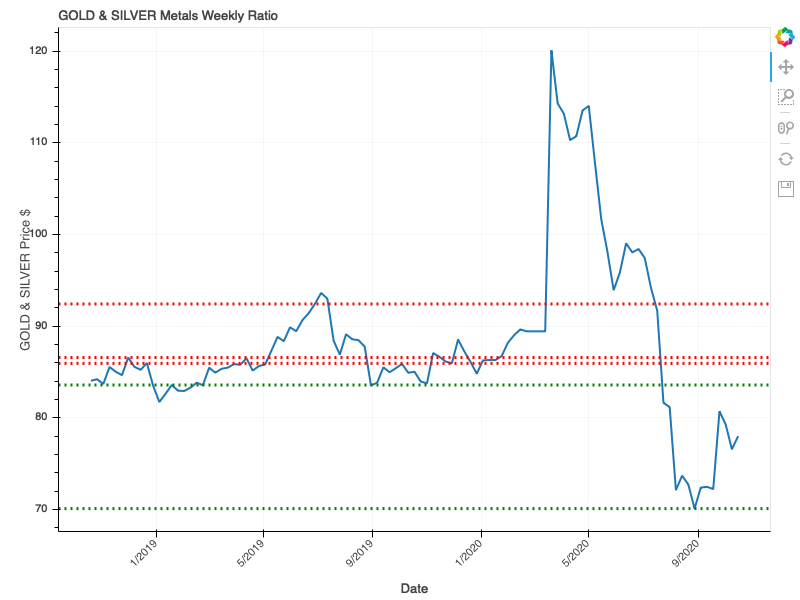
Our models show that the Gold to Silver ratio remains in a down trend, with the ratios continuing to trend lower for foreseeable future. Next week’s forecast is for the ratio to close lower to 77.49 from 77.98. This indicates either support for Silver at these levels or Gold will move higher.
Our long term prospects for Gold and Silver remain Bullish and our price targets remain $2,500 and $40 respectively.