Gold & Silver Market Report for Oct 24, 2020
Market Report Gold SilverIt’s Saturday, October 24, 2020, and this is your week’s gold and silver market report. Gold and Silver closed mixed this week with a loss of -0.03% and +1.06% to $1,905.20 and $24.62 respectively. Both metals are still trying to break higher but can’t seem to close above the bearish candle from 4 weeks ago. We are in a protracted consolidation phase as we drift toward the Nov 3, 2020 elections. If the elections are contested we should see volatility in both metals as the markets assess the situation.
Gold Chart
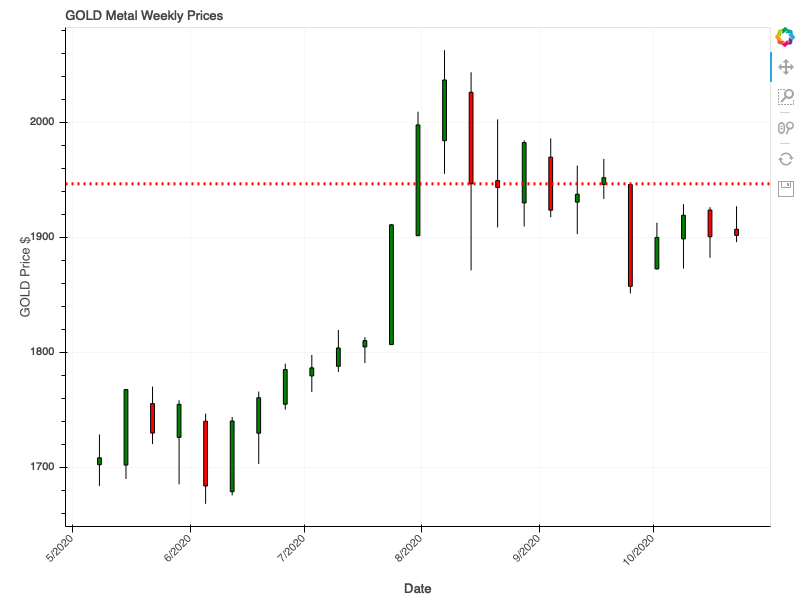
Gold’s price range is contracting and the prevailing trading wisdom is that ‘contraction precedes expansion’ except we don’t know when the expansion will happen and to which side (upside or downside). Our models were correct that gold closed lower last week and it’s forecasted to close lower next week to $1,902.37. However, the technicals show that Gold prices are at risk for a sell-off down to the $1,800 range.
Buying Gold and Silver Bullion and Coins
Sometimes it's hard to find a good coin dealer. In those cases I like to check out what's available on Amazon. Here are some options to gold bullion and coins from there.
Silver Chart
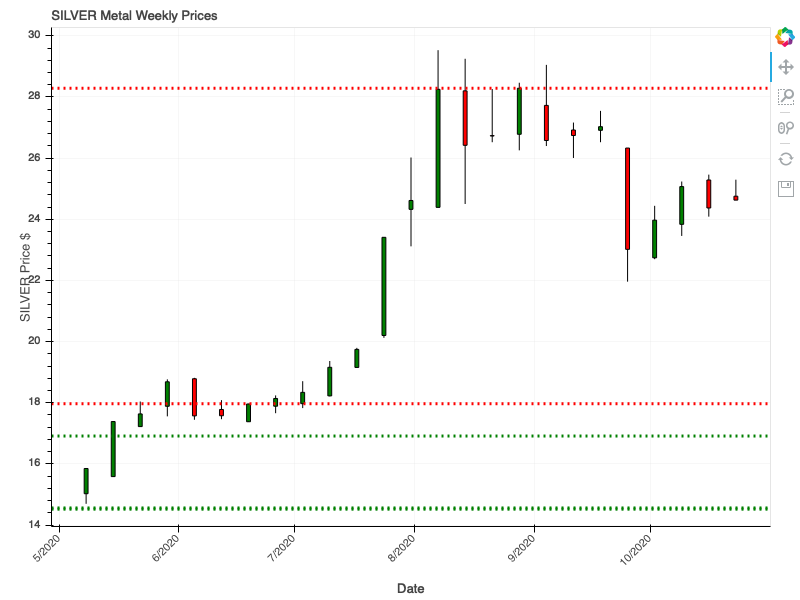
Silver had a very volatile week and closed slightly higher from our forecast last week. It too is struggling to find direction as its trading range is narrowing. Just like with Gold, contraction of the range will precede expansion of the range but we don’t know when and on which side it will move. Technical patterns show that there is a huge risk for Silver to make a break to the $17-$18 price level and we will continue to watch this metal like a hawk. Our models continue to point to a lower close for Sliver next week to the $24.53 level.
Buying Gold and Silver Bullion and Coins
Sometimes it's hard to find a good coin dealer. In those cases I like to check out what's available on Amazon. Here are some options to buying silver bullion and coins from there.
Gold to Silver Ratio Chart
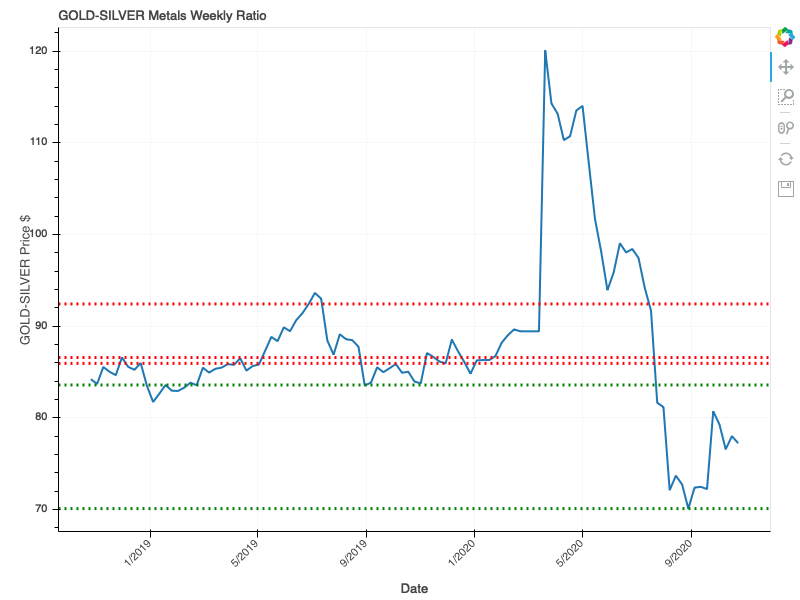
The Gold to Silver ratio closed lower to 77.23 as predicted by our models. The ratio remains in a long protracted downtrend but our models forecast the ratio to close slightly higher to 78.81. This may indicate more volatility for Silver next week with prices moving lower or Gold breaking out higher. Any move above 80 in the short term Silver speculators are capitulating and unloading Silver positions after being trapped above $30/oz for Silver.
Gold to EURUSD Ratio Chart
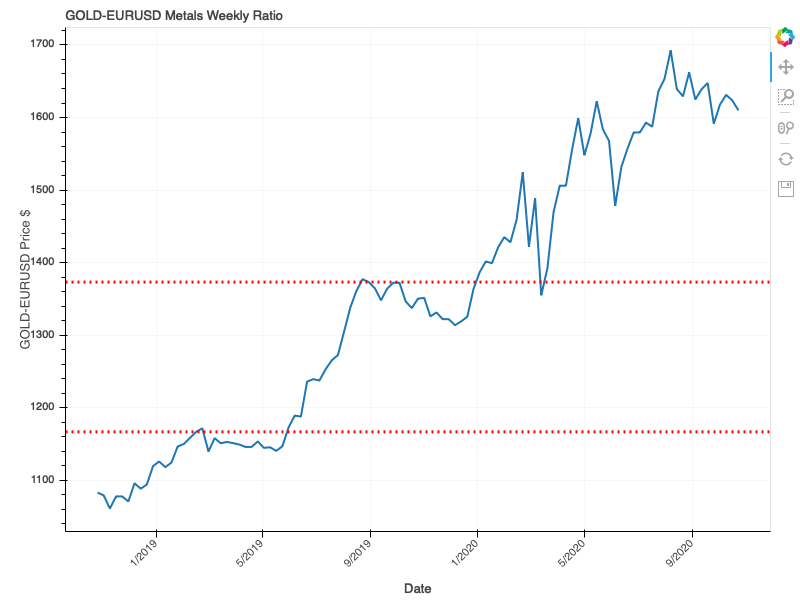
Our last chart of the report is a quick inspection of how well Gold prices are relative to the Euro. We are reviewing this for curiosity’s sake and find it interesting that the ratio is in such a long uptrend. This is probably due to the Euro’s long-term outlook as a stronger currency than the USD.
The model is forecasting that the Gold to Euro ratio will close higher to 1,637.03 from 1,623.62. This indicates a strengthening of gold prices relative to the Euro and might provide some clues to what will happen in the US markets next week with the US Dollar weakening.