Gold & Silver Market Report for Dec 26, 2020
Market Report Gold Silver BitcoinIt’s Saturday, December 26, 2020 and this is the last Gold and Silver market report for 2020! Look to more market reports in 2021 with additional market commentary when applicable.
Gold and Silver Markets closed lower last week with Gold closing down -0.58% to $1,874.69 and Silver down -0.46% to $25.82.
Our properietary models all point to Gold and Silver being fairly valued at these levels. Any price movements above these values are considered forthy and prone to corrections. Conversely, any prices moves below these values constitutes a good value play.
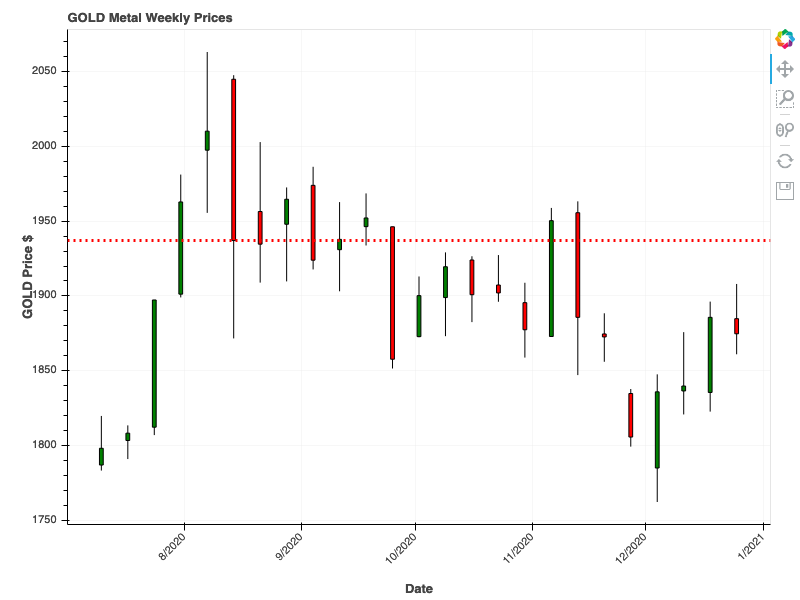
Gold Chart
Bears came out this week to stop any upward price moves for Gold. We had previously written that Gold appears to be making lower highs and lower lows. Our models show that the trend for Gold remains down and we continue to see lower price moves for Gold in the next week.
Our models are predicting a lower close for Gold next week to the $1,866.00 level.
Buying Gold and Silver Bullion and Coins
Sometimes it's hard to find a good coin dealer. In those cases I like to check out what's available on Amazon. Here are some options to gold bullion and coins from there.
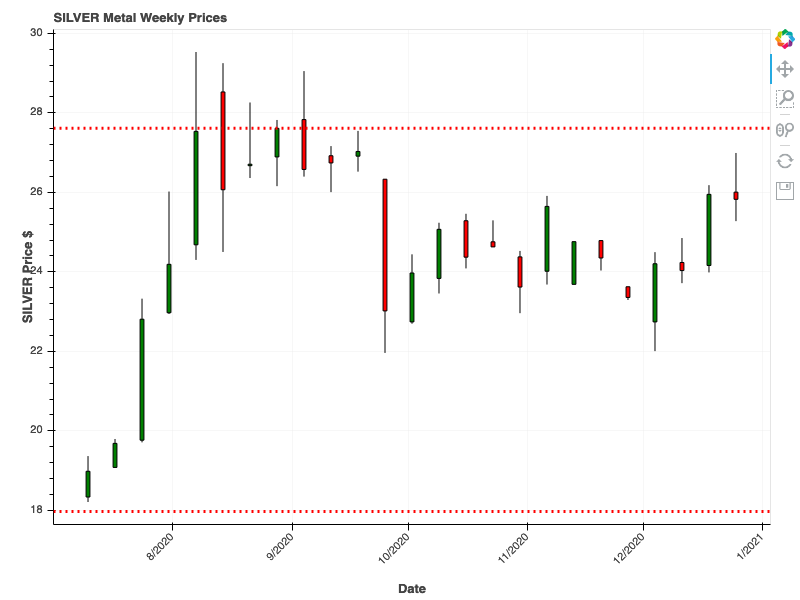
Silver Chart
Per the usual, Silver had a volatile week but Silver Bears stopped a potential test of the $27.61 resistance line. There was an attempt to break out of the range that Silver has been in for several weeks but it failed too.
Our models point a lower close for Silver next week, to the $25.60 level. Trends remain down with prices expected to drift within $22 to $26 level until a successful test and break out above the resistance line.
Buying Gold and Silver Bullion and Coins
Sometimes it's hard to find a good coin dealer. In those cases I like to check out what's available on Amazon. Here are some options to buying silver bullion and coins from there.
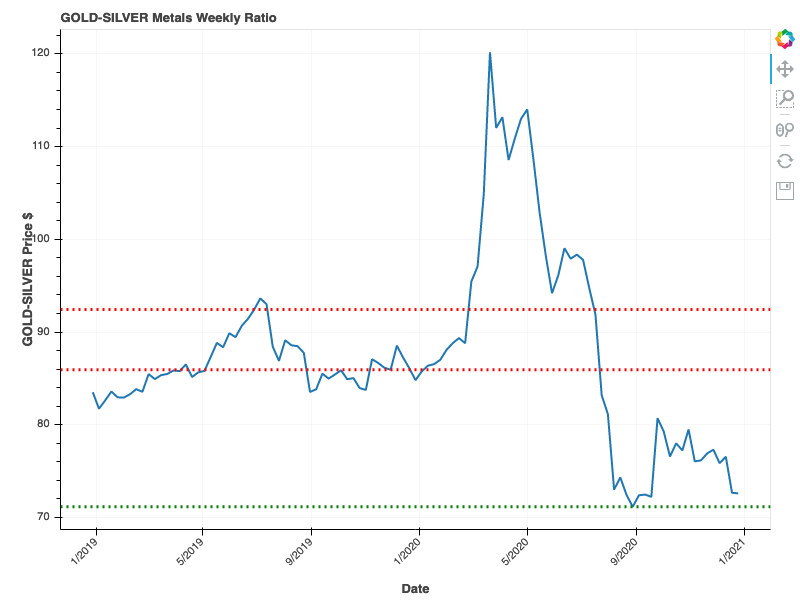
Gold to Silver Ratio Chart
The Gold to Silver Ratio closed lower this week to the 72.59 level, a strong indicator of Gold and Silver’s congruent moves last week. Our models are predicting a higher move for the ratio to 73.23. This indicates that Silver prices may ease to the downside or that Gold might move higher from there. Whatever it ends up being, expect the gold and silver markets to be volatile next week.
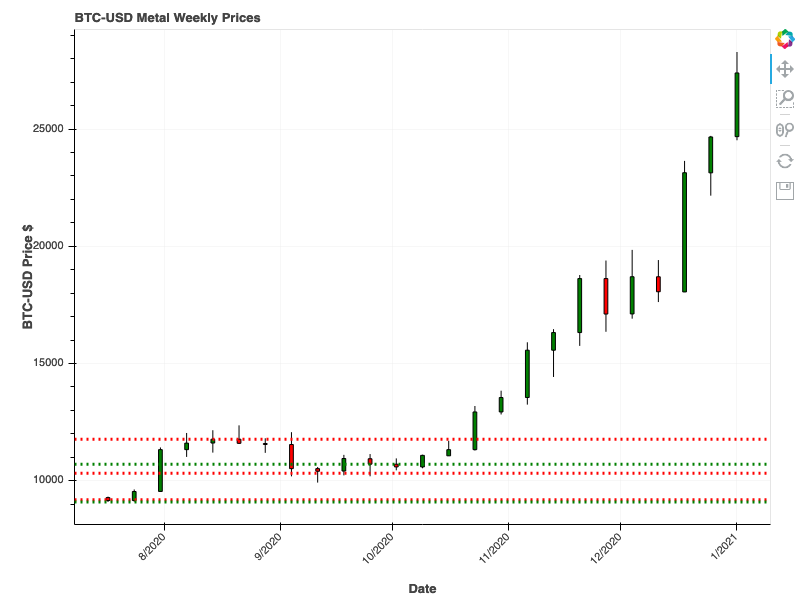
BTC to USD Chart
Starting in 2021, we will be including a current Bitcoin chart and running our proprietary models against this cryptocurrency. To close out 2020, here’s a current chart of Bitcoin vs the USD. It’s easy to see that prices are in a strong uptrend but our models predict a lower close for Bitcoin next week, down to the $26,600.
We have been avid “collectors” of Bitcoin over the years and believe that it can be a store of wealth, much like Gold and Silver and their coin derivatives.
Learn Stock Trading, Investing, and Risk Management
There are a handful of financial and trading books that have made a HUGE impact on my investments. If you want to trade and learn about money and risk management then I suggest you get the Van Tharp book. If you want just focus on long term investing, get the Random Walk Down Wall Street book.
Hell, get them both. I owe my wealth to what I learned in those books.