How to Generate an Egg Price Chart in Python
Use the St Louis Federal Reserve data to generate an egg price chart
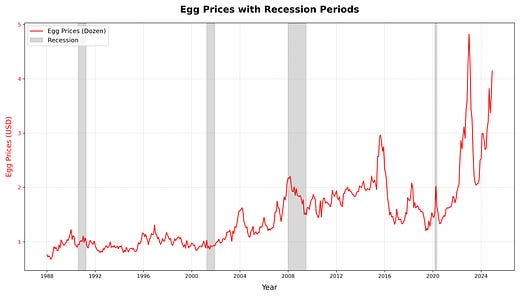
I’m in love with the Pandas DataReader library and how easy it is to grab data from the Federal Reserve. Granted, the data is a bit behind the current egg prices but it’s nice to have historical data to chart. This is what the chart looks like when you use the Python code below. Note, that I superimpose recession periods in a shaded gray color.
import pandas as pd
import matplotlib.pyplot as plt
from pandas_datareader.data import DataReader
from datetime import datetime

# Fetch data functions
def fetch_data_from_fred(series_id, start_date="1988-01-01"):
    """
    Fetches data from FRED.

    Args:
        series_id: The ID of the series to fetch.
        start_date: Start date for data.

    Returns:
        DataFrame with date index and data values.
    """
    end_date = datetime.now()
    data = DataReader(series_id, "fred", start_date, end_date)
    return data

def get_recession_periods(recessions):
    """
    Extracts periods of recessions.

    Args:
        recessions: DataFrame containing recession indicators (1 for recession, 0 otherwise).

    Returns:
        List of tuples representing start and end dates of recessions.
    """
    recession_periods = []
    in_recession = False
    start_date = None
    for date, value in recessions.iloc[:, 0].items():
        if value == 1 and not in_recession:
            in_recession = True
            start_date = date
        elif value == 0 and in_recession:
            in_recession = False
            end_date = date
            recession_periods.append((start_date, end_date))
    return recession_periods

def plot_egg_price_with_recessions_and_inflation(egg_prices, inflation_rate, recession_periods):
    """
    Plots the price of eggs and inflation rate with recession periods.

    Args:
        egg_prices: DataFrame with egg price data.
        inflation_rate: DataFrame with inflation rate data.
        recession_periods: List of recession periods (start and end dates).
    """
    fig, ax1 = plt.subplots(figsize=(14, 8))

    # Plot egg prices
    ax1.plot(egg_prices.index, egg_prices.iloc[:, 0], color="red", linewidth=1.5, label="Egg Prices (Dozen)")
    ax1.set_xlabel("Year", fontsize=14, labelpad=10)
    ax1.set_ylabel("Egg Prices (USD)", fontsize=14, labelpad=10, color="red")
    ax1.tick_params(axis="y", labelcolor="red")
    ax1.grid(visible=True, which="major", linestyle="--", linewidth=0.5, alpha=0.7)

    # Add recession periods
    for start_date, end_date in recession_periods:
        ax1.axvspan(start_date, end_date, color="gray", alpha=0.3, label="Recession" if start_date == recession_periods[0][0] else "")

    # Plot inflation rate
    #ax2 = ax1.twinx()
    #ax2.plot(inflation_rate.index, inflation_rate.iloc[:, 0], color="blue", linewidth=1.5, linestyle="--", label="Inflation Rate")
    #ax2.set_ylabel("Inflation Rate (%)", fontsize=14, labelpad=10, color="blue")
    #ax2.tick_params(axis="y", labelcolor="blue")

    # Combine legends
    lines, labels = ax1.get_legend_handles_labels()
    #lines2, labels2 = ax2.get_legend_handles_labels()
    ax1.legend(lines, labels, fontsize=12, loc="upper left") #lines + lines2, labels + labels2

    # Add copyright text
    fig.text(0.96, 0.10, "(c) neuralmarkettrends.com", fontsize=10, color="red", ha="right", va="bottom")

    # Title and layout
    plt.title("Egg Prices with Recession Periods", fontsize=18, fontweight="bold", pad=20)
    plt.tight_layout()
    plt.savefig('egg-prices-with-recessions.png', dpi=300)
    plt.show()

# Main script
if __name__ == "__main__":
    try:
        # Fetch data
        egg_prices = fetch_data_from_fred("APU0000708111")  # Egg prices (average per dozen)
        #inflation_rate = fetch_data_from_fred("CPIAUCSL")  # Inflation rate (CPI, all items)
        recession_data = fetch_data_from_fred("USREC")  # US Recession indicators

        # Get recession periods
        recession_periods = get_recession_periods(recession_data)

        # Plot data
        plot_egg_price_with_recessions_and_inflation(egg_prices, 0, recession_periods)
    except Exception as e:
        print(f"An error occurred: {e}")


