RapidMiner AI Finance Model - IV
Tutorials Optimization Time Series Machine Learning AI MultiObjective Feature Selection Tutorials** There are NEW livestream videos about RapidMiner! Visit my Channel here **
In Lesson 3, I introduced the Sliding Window Validation operator to test how well we can forecast a trend in a time series. Our initial results are very poor, we were able to forecast the trend with an average accuracy of 55.5%. This is fractionally better than a simple coin flip! In this updated lesson I will introduce the ability of Parameter Optimization in RapidMiner to see if we can forecast the trend better.
Parameter Optimization
We begin with the same process in Lesson 3 but we introduce a new operator called the Optimize Parameter (Grid) operator. We also do some house cleaning for putting this process into production.
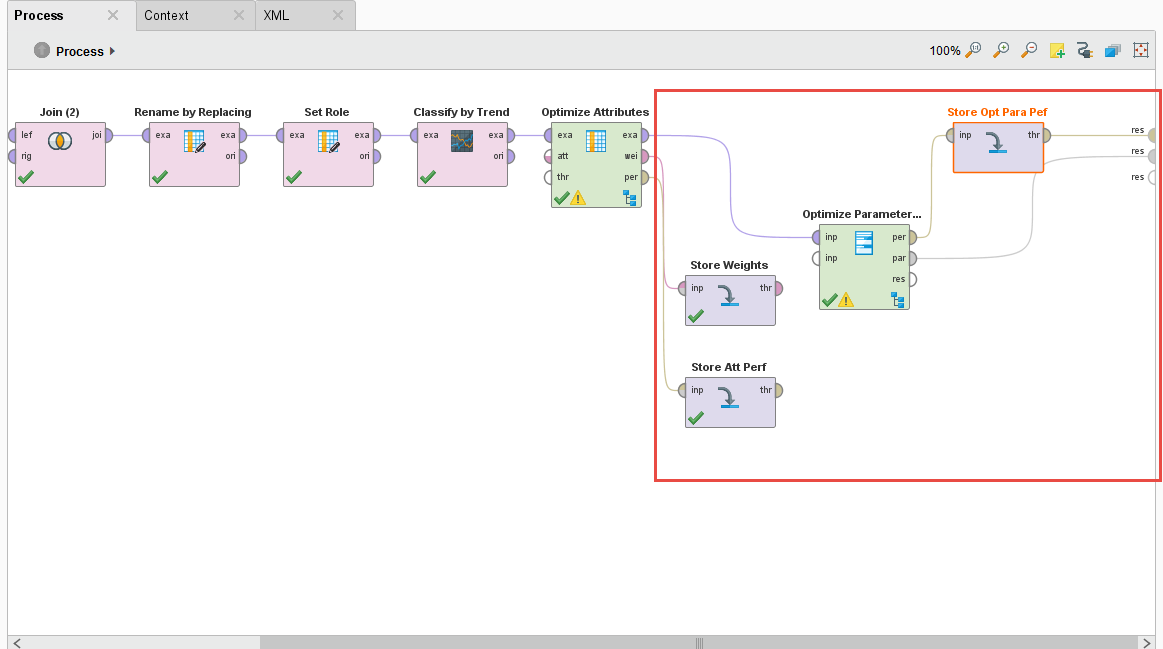
The Optimize Parameter (Grid) operator let’s you do some amazing things, it lets you vary – by your predefined limits – parameter values of different operators. Any operator that you put inside this operator’s subprocess can have their parameters automatically iterated over and the overall performance measured. This is a great way to fine tune and optimize models for your analysis and ultimately for production.
For our process, we want to vary the training window width, testing window width, training step width on the Sliding Window Validation operator, the C and gamma parameter of the SVM machine learning algorithm, and the forecasting horizon on the Forecast Trend Performance operator. We want to test all combinations and ultimately determine the best combination of these parameters that will give us the best tuned trend prediction.
Note: I run a weekly optimization process for my volatility trend predictions. I’ve noticed depending on market activity, the training width of the Sliding Window Validation operator needs to be tweaked between 8 and 12 weeks.
I also add a few Store operators to save the Performance and Weights of the Optimize Selection operator, and the Performance and Parameter Set of the Optimization Parameter (Grid) operator. We’ll need this data for production.
Varying Parameters Automatically
Whatever operators you put inside the Optimize Parameters (Grid) operator can have their parameters varied automatically, you just have to select which ones and set minimum and maximum values. Just click on the Edit Parameter settings button. Once you do, you are presented with a list of available operators to vary. Select one operator and another list of available parameters is shown. Then select which parameter you want and define min/max values.
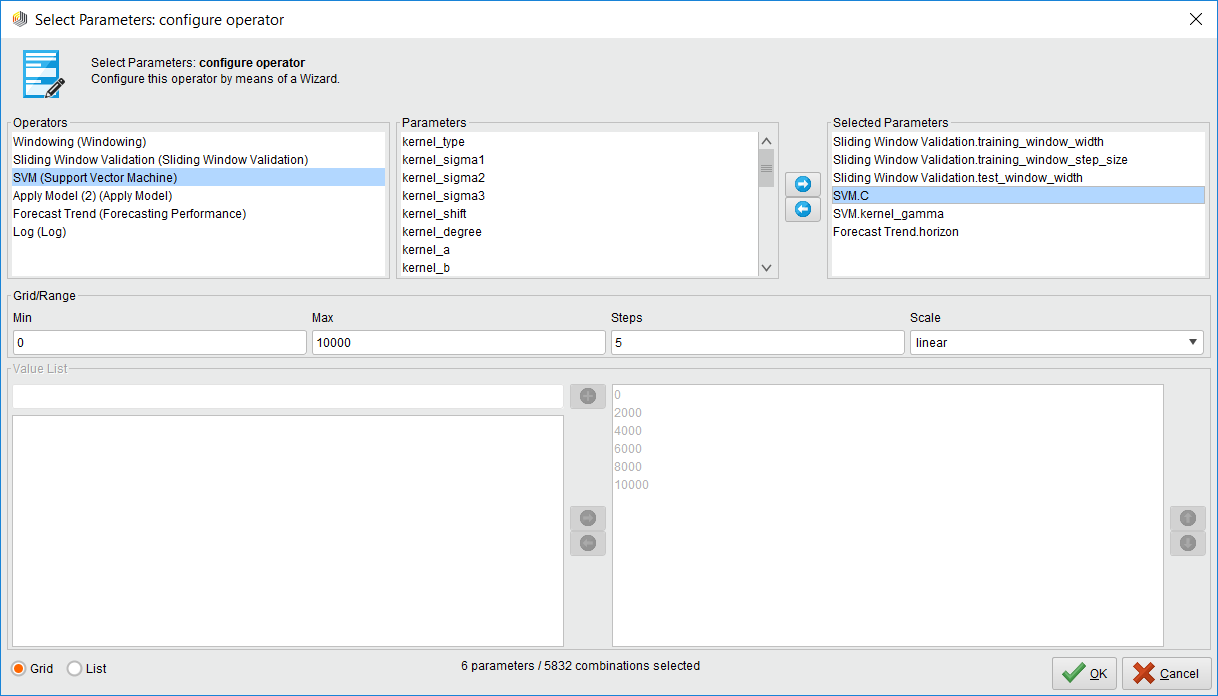
Note: If you select a lot of parameters to vary with a very large max value, you could be optimizing for hours and even days. This operator consumes your computer resources when you millions of combinations!
The Log File
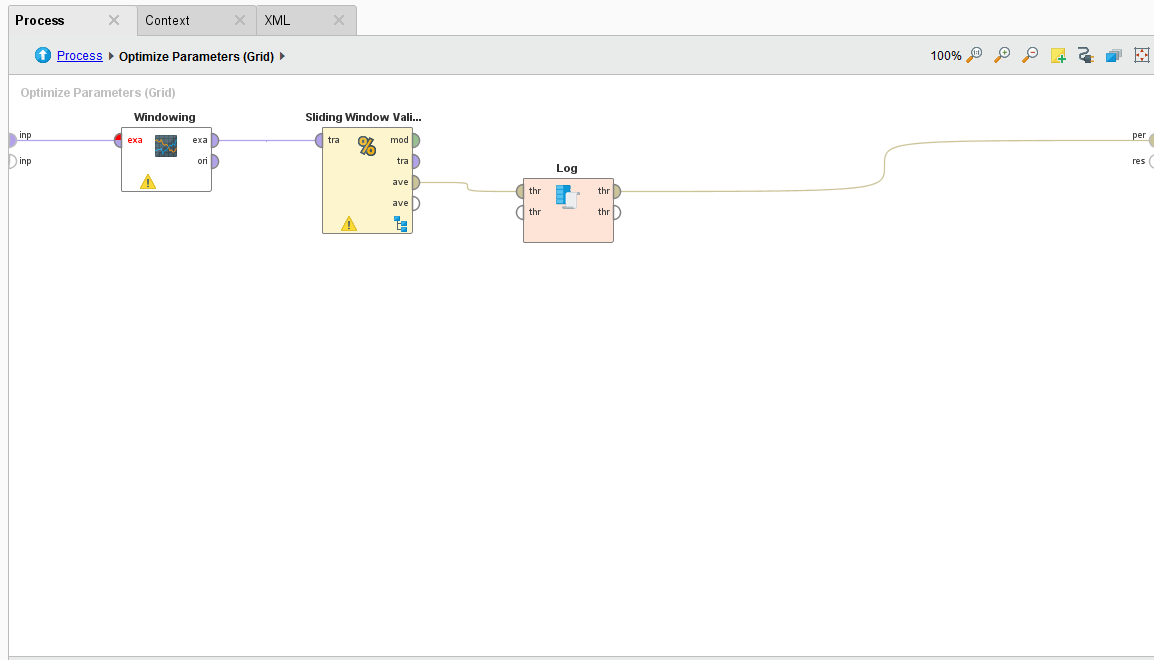
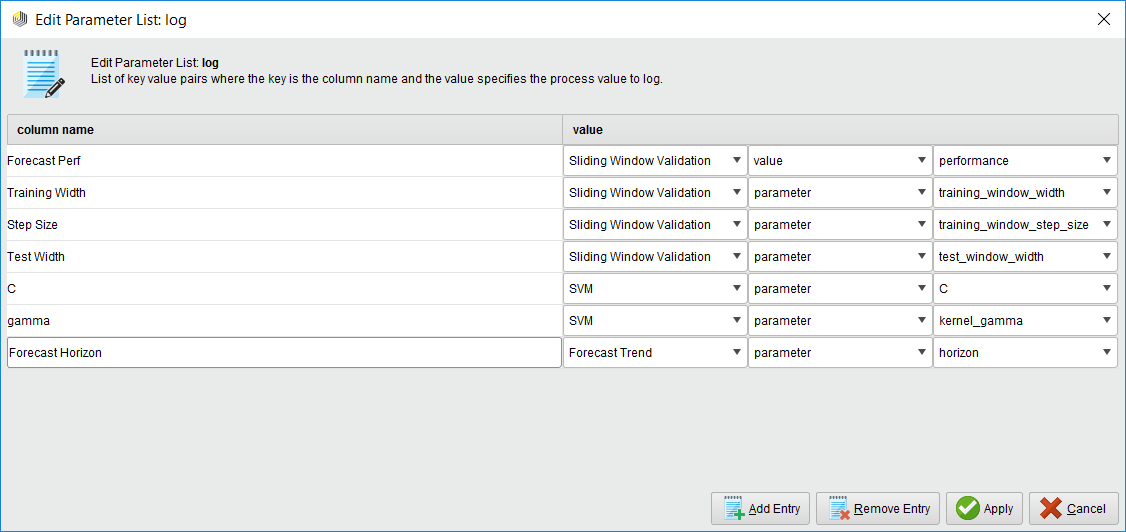
The log file is a handy operator that we use in optimization because we can create a custom log file that has the values of the parameters we’re measuring and the resulting forecast performance. You just name your column and select which operator and parameter you want to have an entry for.
Pro Tip: If you want to measure the performance, make sure you select the Sliding Window Validation operator’s performance port and NOT the Forecast Trend Performance operator. Why? Because the Forecast Trend Performance operator generates several models as it slides across the time series. Some performances are better than others. The Sliding Window Validation operator averages all the results together, and that’s the measure you want!
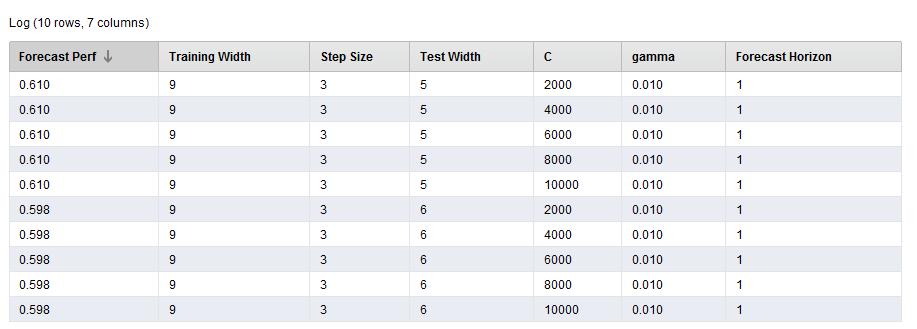
This is a great way of seeing what initial parameter combinations are generating the best performance. It can also be used to visualize your best parameter combinations too!
The Results
The results are point to a parameter combination of:
- Training Window Width: 10
- Testing Window Width: 5
- Step Width: 4
- C: 0
- Gamma: 0.1
- Horizon: 3
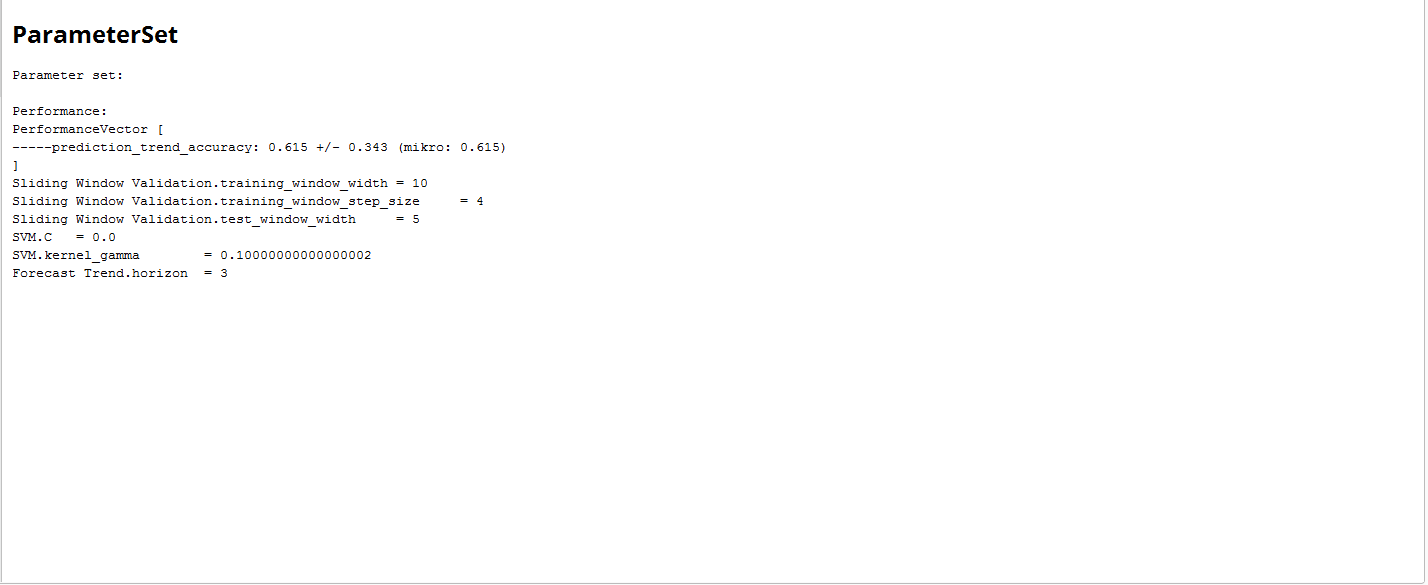
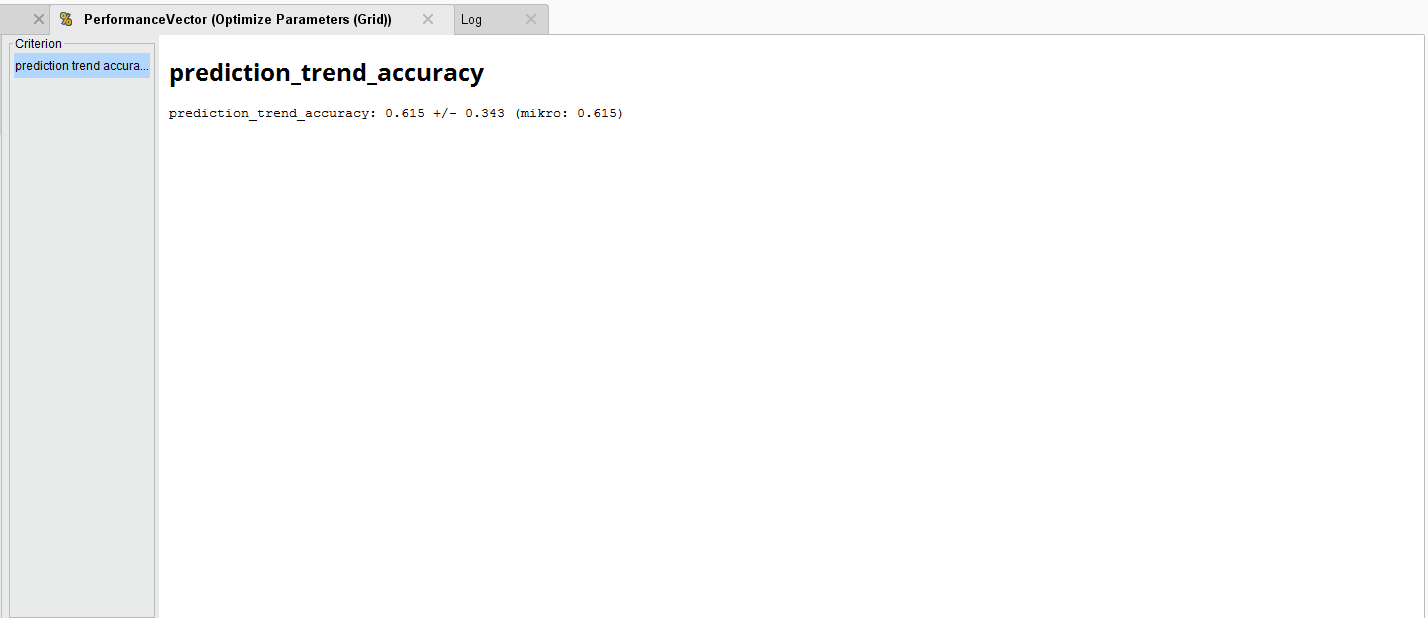
To generate an average Forecast Trend accuracy of 61.5%. Compared to the original accuracy, this is an improvement.
That’s the end of Lesson 4 for your first AI financial market model. You can download the above sample process here. To install it, just go to File > Import Process.
_This is an update to my original 2007 YALE tutorials and are updated for RapidMiner v7+. In the original set of posts I used the term AI when I really meant Machine Learning. _