When I was first introduced to data mining and modeling, I felt like I had found the goose that laid the golden egg. I thought, erroneously, that I could create a predictive model that would be able to tell me what the closing price would be for a specific asset. I successfully modeled the S&P500 Spiders (SPY) and was able to predict the daily closing price within a 3% price range. I soon learned that this only worked well when the market was trending in a one direction. If the market turned on a dime, as it usually does, the model would fall apart.
So I scratched that pipe dream and focused on identifying macro trends instead. Having successfully modeled currency, stock, and future trends, I decided to start fooling around with market timing. I’m a firm believer that market timing is critical to financial success and here’s why. When I was in MBA school, I had written an independent research paper about Hedge Funds and the various trading strategies they use. One strategy I discovered was a volatility based strategy that would invest money during times of extreme market volatility. I analyzed three fictional portfolios to see if the volatility based strategy was superior to a buy and hold, and dollar cost averaging strategy.
I used the $VIX as my volatility indicator and assumed each investor would buy into the S&P500. The results shocked me! I don’t remember the exact percentages anymore (I’ll try to dig out the paper and post it) but a buy and hold investor would get a 14% return (not bad), a dollar cost averaging investor would get a 20% return (even better), and a volatility based investor would return over 100% over the same time period. Damn!
Then I read “The (Mis)Behavior of Markets†and realized that its easier, and smarter, to model volatility instead of prices. If I were able to forecast and determine the magnitude of volatility for a future event, I would be ready to take profits or buy in. Now that would be truly profitable!
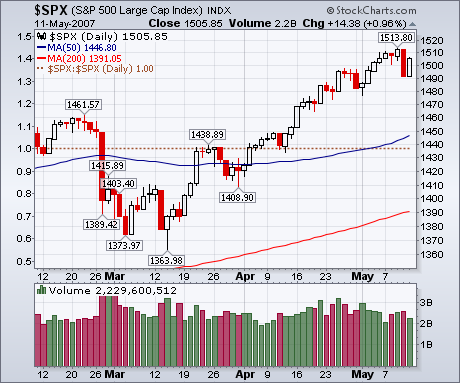
So I began working on a S&P500 Volatility Timing Model, which is in testing phase right now. Its not perfect and it has few bugs in it (only 66% correlated) but here’s a snapshot of volatility vs. the S&P500 over the last three months. See anything that could make you money? Note: 1 is very volatile and anything below 0 is low volatility.

Have a good weekend all!