Violin Plots of Volatility
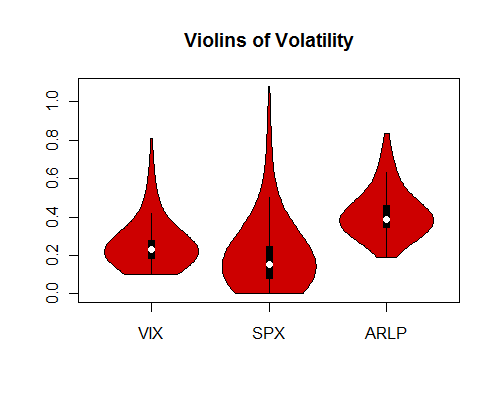
AI Machine LearningI came across a fantastic R script from blogger Milk Trader. It’s about generating something called violin plots of volatility for the S&P500 index and the VIX, which he got from this CBOE paper. I took that script a bit further and added in one of my current trend positions, $ARLP, just for fun.

The plot is essentially a “combination of a box plot and a kernel density plot” and shows us the absolute value of volatility (negative returns are represented as positive) on the y axis.
A very simple R code (you can get it on his site) with a great visual impact. Â Great job Milk Trader!